This is from Week 1, Optional Lab 4
In this line

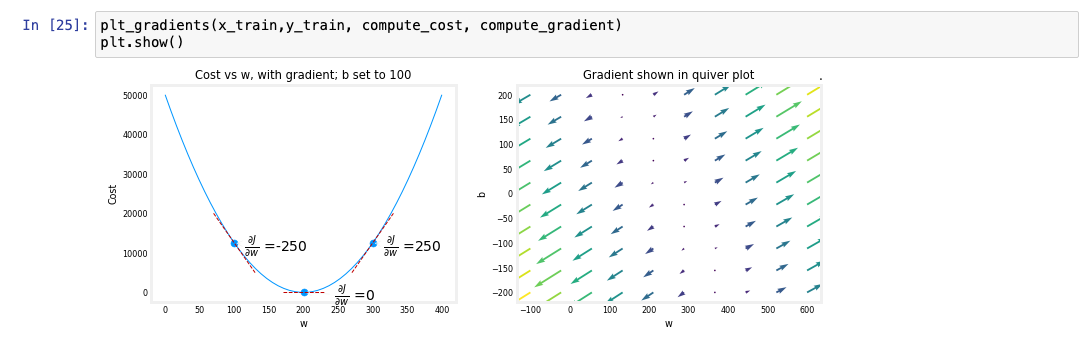
Where in the code does it define the values of w and b? I was wondering how it is able to generate this graph.
This is from Week 1, Optional Lab 4
In this line
Where in the code does it define the values of w and b? I was wondering how it is able to generate this graph.
Ahh, now I get it, plt_gradients is from the imported library, my bad
‘w’ and ‘b’ are defined via the parameters that are passed when the compute_cost() function is called.