Today marks the first time I’ve ever looked at a line of code or a Jupyter notebook. Everything up to Model Function of setting the w and b parameters makes sense. When trying to do the challenge, “Try experimenting with different values of 𝑤 and 𝑏,” none of the variables is creating a line that fits the data. I’m unclear what the 𝑤 and 𝑏 represent in the table to get them to fit on the existing blue line from the two training examples (m).
The weight value ‘w’ represents the slope of the line.
The bias value ‘b’ represents the offset along the vertical axis.
Note that this course assumes you already are familiar with Python programming. I recommend you attend an introduction course on Python, and then return to this course.
Can you point me to where in the course description it says this? It’s presented as a Beginner-level course across Coursera.
This also didn’t answer the question as to why the given w and b variables produced a linear regression that’s far above the actual values.

Maybe someone else can help…

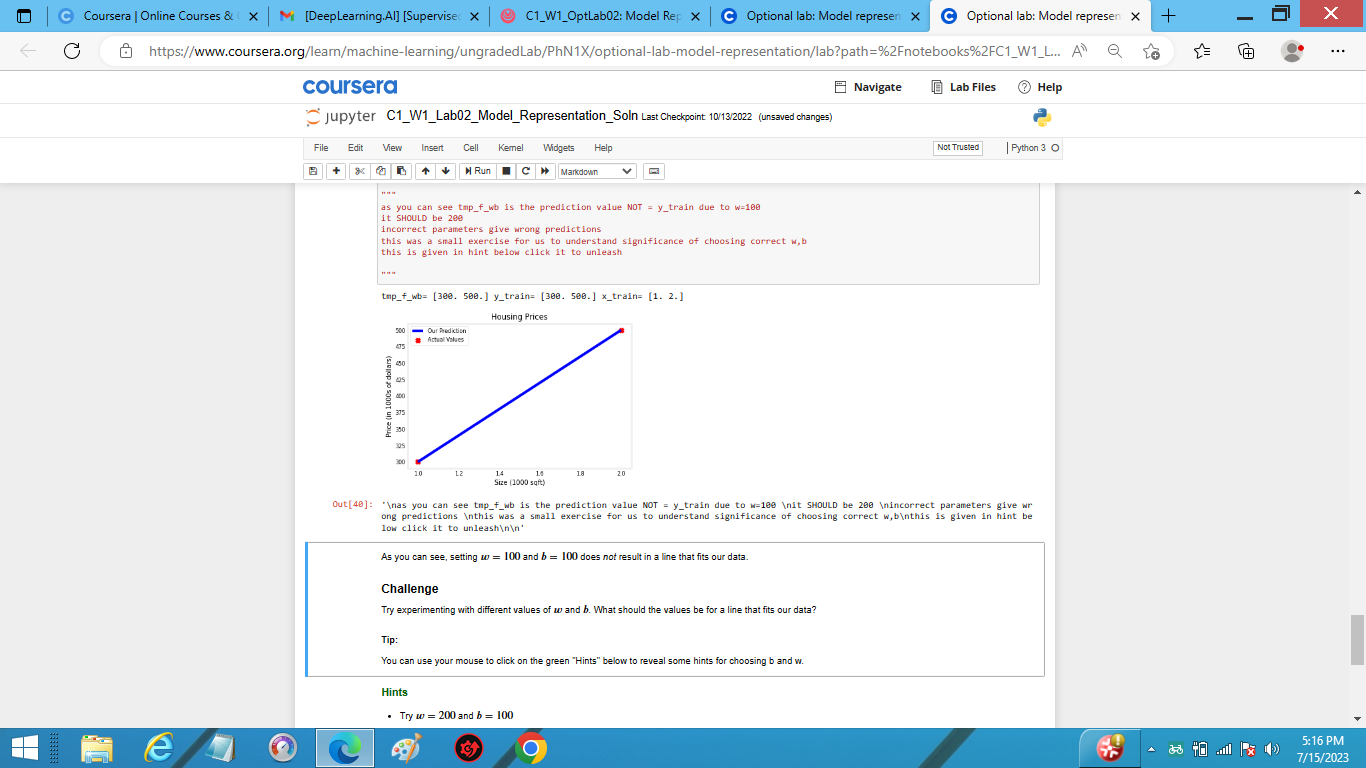
thank you! understanding that w=slope makes a big difference. by adjusting the slope, the blue line correctly fit the data points. I used Claude 2.0 to go through it all line by line so it all makes sense. agree having some understanding of python helps, which they don’t say is necessary to take the class.
thx again
I can estimate how you are feeling after being disappointed by that problem but even I stucked there.
Letter I could understand after trying that out.
I know it’s hard but if you are a native like speaker in English or fluent enough then you please do see these functions plt.scatter & plt.plot these belong to 1 library with different features
Same for lib & scikit having different features with different capabilities that you can understand by constantly observing.
After sometime in this course it will be easier to understand everything.
So like if you know python is upper hand upon the course but if you knew not that you sure must be creatively observing them.
Signed up for and almost finished an intro to Python course to help me through this course. I’m sticking to it as so far, it’s great.