I am going through the “Optional Lab - Simple Neural Network“ in “Advanced Learning Algorithms” class Week-1.
I am confused by a couple of things there:
The description says that we are building a Neural Network. I believe that is an AI model. But then, why are we using the trained weights and biases from the previous lab in TensorFlow? Isn’t training the model (aka finding these weights and biases), one of the important parts of building a model?
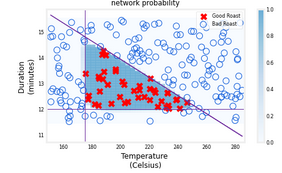
In the final cell two graphs are generated. The description says, “the Left graph is the raw output of the final layer represented by the blue shading.” What does “raw output” even mean?
Can someone please clarify these two points for me?
For (1), you are absolutely right that the training of model is an important part, so it is demonstrated in various labs in this course. It’s only that, I believe, the lab maker had a different objective for this particular lab that you questioned about, which is that it was intended to show us the underlying of tensorflow model with a numpy version. You know, tensorflow encapsulates all the details, but Andrew had been teaching the details, so wouldn’t it be a good idea that we see it for ourselves that indeed what we learned is what tensorflow does? Therefore, I think it is just a matter of different expectations for this lab. Your expectation is totally in the right direction, only you might consider this lab as a little side-track from that.
For (2), it says “the raw output … represented by the blue shading”. The blue shading tells us the area which the predicted “probability of being y=1” are highest, so since it is prediction, the blue shading is a result of the output of the model and that is the meaning of “raw output”. It is the “raw output” of the model that generates the blue shading. I think by “raw”, it means that we have not applied any threshold. You see, after the threshold, it is either “1 or 0”, but before the threshold, it is the “probability of being y=1” and perhaps “raw” means the probabilities.
Btw, if we inspect the left graph, on the right side, there is a vertical bar that shows a gradient of blue colors. It is saying that it is using different blueish colors for different levels of predicted probabilities. What I want to say is, the “blue shading” is not just “blue” or “not blue”, so it is probability and it is “raw”.
Thank you for the detailed response, Raymond @rmwkwok. Now that I understand the material better, I have one follow up question.
For (2), it appears the shaded triangle is quite deep blue in color such that almost all of the probabilities are close to 1. And everything outside the triangle is almost white in color. That is, probabilities close to zero. If so, that is fine.
However, shouldn’t the raw probabilities be for the input training data points only? That is, exactly where we have the Xs and Os. Why and how did the model generate probabilities for places in the graph where we don’t have input training data points?
You are welcome, Senthil. If you read the utility code (which is available by clicking “File” > “Open” in the jupyter’s menu), you will see that they don’t draw the shaded area using the training data points, instead they created a grid of points that cover the whole plotting area and asked the model what the probabilities were for each of those points.
So, we can ask our model to make prediction at anywhere.