can we compare the results of the same data set with different percentages of split?
i split my data into 80% training and 20 test set and my colleague split the same data into 70% training and 30 test set
can we compare our results in terms of coefficient of determination R² and RMSE in training and test set ?
Hi there,
you want to make sure that your data, considering the chosen split is representative of your data and real world problem. E.g. your training set should contain all representative conditions so that your model has the chance to learn all relevant characteristics from the data.
In case this applies here, I assume your friend and you would end up with comparable metrics (with respect to R^2) given that all other (hyper-) parameters and boundary conditions are being equal. I think it would be useful to do also a residuum analysis and check the distribution.
Feel free to to this comparison and interpret or discuss your findings.
A nice way to get familiar with different splits (not necessarily split ratios) is cross validation.
It’s can also be helpful for dealing with overfitting issues.
Feel free to take a look:
- Cross-validation (statistics) - Wikipedia
- 3.1. Cross-validation: evaluating estimator performance — scikit-learn 1.1.1 documentation
Best regards
Christian
1 Like
Regarding RMSE: when comparing results, please check the length of the vector and how it would impact the result in the formula:

E.g. a strong outlier could impact the metric more due to the quadratic influence of the error. So here it depends whether this point was shuffled in you train or test set…
If there would be a difference, you can check numerator for example and plausibilize why this is the case.
If you conduct the above mentioned residuum analysis for training and test data I would assume you can have a good comparability, especially with respect to residual distribution.
Hope that helps!
Please what does mean residuum analysis ?
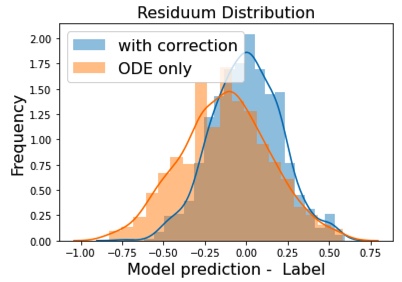
Residuals are differences between predicted output from the model and the labels. Thus, residuals represent the portion of the data not explained by the model.
It’s important to understand:
- how are the residuals distributed
- that residuals are (hopefully!) not correlated with your features.
Here is an exemplary residuum plot showing how the model error (or model deviation) is distributed: