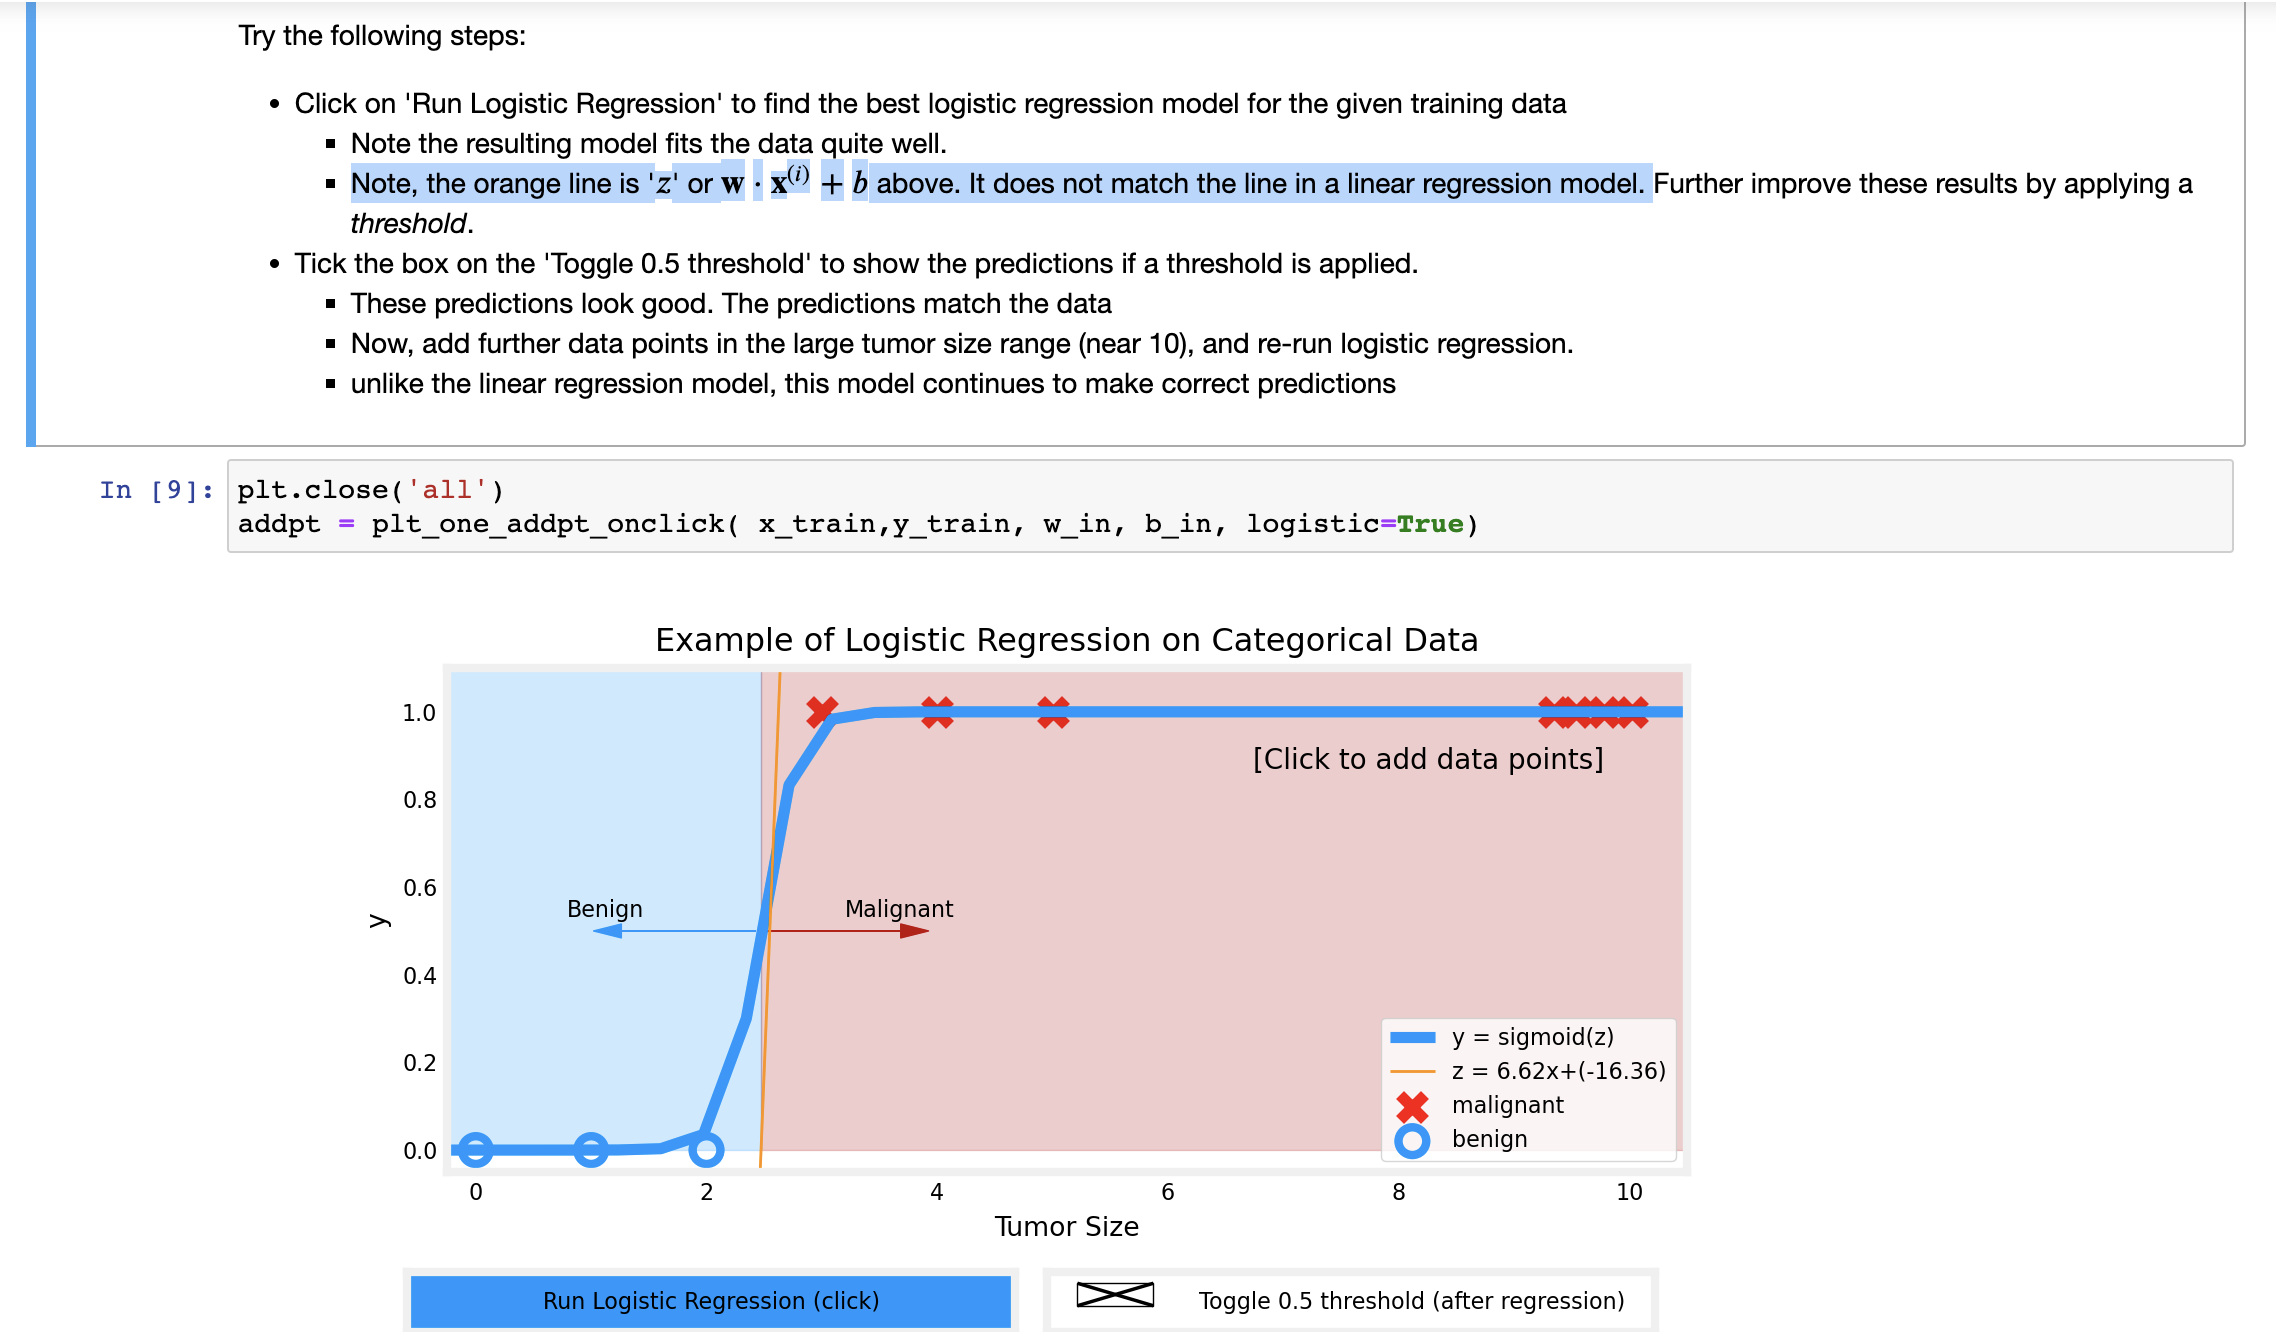
In the provided image from the sigmoid function lab. What does it exactly imply when one says " Note, the orange line is ‘𝑧’ or ‘𝐰⋅𝐱(𝑖)+𝑏’ above. It does not match the line in a linear regression model."
Why are the two different and how exactly does ‘z’ differ from the plot of a linear regression model?
Both lines fit to the same set of data, but the first one assumes a linear regression model whereas the second one assumes a logistic regression model.
What can you tell about the difference in the two lines? (Which one attempts to be a boundary line and which one attempts to fit through itself to the data points?)