w1 LAB: Optimization Using Gradient Descent in One Variable. I was playing with the chart, clicking on the plotted graph setting different initial points to see how to convergence occurs. When I clicked on a point closer to the y-axis (you can see a circle near y-axis at 6), I noticed the gradient descent calculation still evaluated points on the right side of the chart (see all the circles on the right end of the curve), with the first point roughly lining up to 7 on y-axis. Why is that?
Shouldn’t the algorithm take the next smaller point?
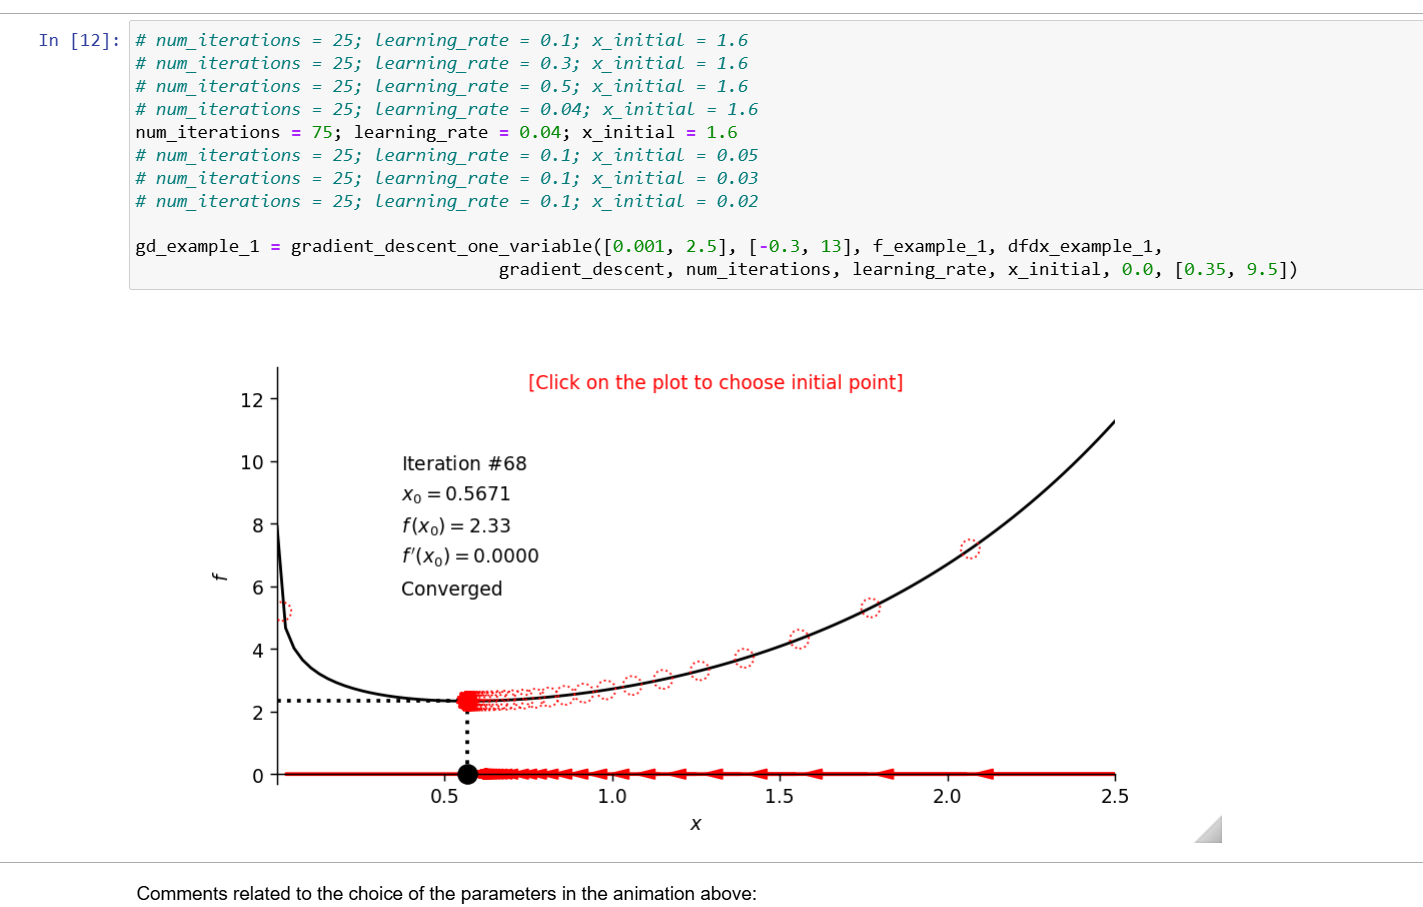
Either the tool isn’t working correctly, or (more likely) the learning rate is too high to handle the large negative gradients at that initial point. It over-corrected too far to the right on the axis, and then had to iterate its way back to the minimum.
1 Like