so i am currently doing Deep learning specialization I wanted to test my skill I have learnt so far and i have recreated car detection using yolo but i am not getting correct boxes drawn on the image can some one help here is my notebook.
YOLO car detection (1).ipynb (334.6 KB)
I have not looked at your code, but the first thing that comes to mind is that in YOLO remember that each object is tied to the cell that reports it. The coordinates are expressed relative to that cell, so you have to translate them to the correct location in the full image based on the location of the reporting cell.
My first guess as to what is wrong is that either you omitted that “translate to the cell location” logic or that you’ve implemented it incorrectly.
Also remember how the coordinate systems work for images: (0,0) is the upper left corner of the image. Positive vertical coordinates move you down the image. Positive horizontal coordinates move you across the image to the right.
ok, now I understood what is the problem.
Thanks a lot for the help
but can you please help me a little more to debug this code as i am facing a little problem doing it
Are you training a model or just taking the output of the model and trying to interpret it?
If the latter, then my suggestion would be to start by printing more of the output. It looks like you are just showing two sets of coordinates for each bounding box. What are those? Are they the corners of the box? What coordinate system are they relative to: the coordinates of the grid cell or the coordinates of the whole image?
I would also print the coordinates of the grid cells at the same time or in parallel. With each car, give the number of the grid cell and then either in a separate list or the same list print the coordinates of that grid cell. Maybe also draw the cells or the centroid of the cells on the image.
The first step is to understand the data and then how to map it onto the image.
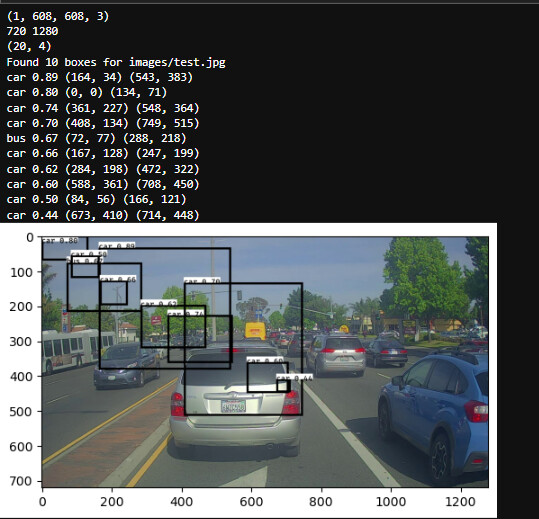
E.g. look at that second car you show in the print outs:
car 0.80 (0,0) (134, 71)
Notice that in the image you did draw a bounding box in the upper left corner, but there is no car there. So my guess is you just didn’t do the thing of converting from “grid cell coordinates” to “image coordinates”. So the first step is to figure out which grid cell that car is being reported as belonging to. Where is that grid cell in the image? Why didn’t the box get drawn relative to that grid cell?
Add more info to those print statements so we can see the number of the grid cell and the corners of the grid cell as well.
i am just taking the output of the model and trying to interpret it in my code. And for it i am using coordinates that are corners of the box(top left and bottom right) and these coordinates are relative to the whole image( original image size )
i tried my level best but still didn’t got any clue about the error till now
can you just look at the code file and try to figure out what i should change.
and one more thing i took the same procedure as described in the programming assignment.
How do you know that? The evidence is that is not true. Look at that one box I pointed out that has upper left corner (0, 0): there is no object in the upper left corner of the image. It’s just blank sky, right? So you must be interpreting the data incorrectly.
If I debug your code for you and just hand you the answer on a silver platter, then you learn essentially nothing out of the process. The point is that if you want to make a career out of this, I’m not going to be there looking over your shoulder to fix things for you whenever you hit a hard problem. My goal here is help you develop your own problem solving skills.
One of the important first steps in any case like this is that you have to make sure you understand the data. That’s what I’m driving at here: you have to really engage with it. It’s pretty clear that it doesn’t mean what you think it means. So how do you figure that out? If I were doing it, my next step would be what I described in one of my earlier responses: print more of the data. Include the number of the grid cell that reports each car and the coordinates of that grid cell. Maybe that would make it more clear what the meaning of the box coordinates is.
Ok, maybe this is simpler than I thought. Note that in your logic it looks like you are not rescaling the boxes from the (608, 608) size of the images as they are handled in the model to the original image dimensions of (720, 1280). Maybe that’s all it is.
But I still don’t understand the bounding box in the upper left corner which claims to be a car with 80% probability …
yes, so i am already resizing the boxes in the yolo_eval() function to original image size but it did not work either and according to what you told earlier i tried and re examined my code and ran it on multiple other images and what i suspect that the model which i am using is not correct as in first image it shows more that 2 car and in second a person so what you think of it ??
Yes, it looks like maybe that model just isn’t working that well. Other things to check would be to make sure the input images you are feeding it are in the expected format, but I guess it’s not so clear how one could check that. Do you have an example of that model being successfully applied?