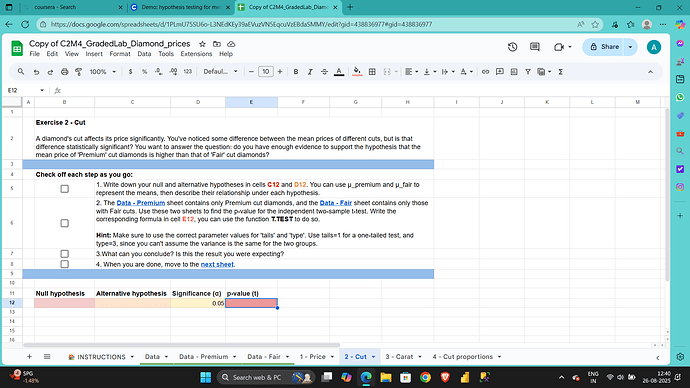
In previous question we already have value with respect null can used. But how to assume the hypothesis here.
I am not mentor for this course, but based on the screenshot, here is how you can apply which hypothesis holds true for type of diamond cut. in your second point, you are giving to two separate data sheets, you calculate the p values and if the the p value is below 0.05, you reject the null hypothesis and go with the alternative hypothesis.
Formula for equal variances (Student’s t-test):
t = (mean1 - mean2) / [sp * sqrt(1/n1 + 1/n2)]
Where sp is the pooled standard deviation, and n1 and n2 are the sample sizes.
2. Determine the Degrees of Freedom (df)
The degrees of freedom are calculated as the total number of observations minus two. df = (n1 + n2) - 2.
3. Find the p-value
Using a statistical table (t-table):
Locate the row corresponding to your calculated degrees of freedom. (remember when calculating degree of freedom between two sample test, usually the sample size of lower count is considered to determine df.
Find the t-values on that row that bracket your calculated t-statistic.
Look at the top of the table for the corresponding p-values (usually presented as two-tailed values).
Your p-value will be between these two values, giving you a range of significance.
Finally if your determined p value for the diamond cut type falls below the significant alpha value of 0.05, you reject the null hypothesis, otherwise go with the alternative hypothesis.
Hi @Anish_Das123!
When we test two groups (here: Premium vs Fair cut diamonds), the null hypothesis assumes no difference in their means (they are equal). The alternative hypothesis states that there is a difference - and since the question specifies “is the mean price of Premium higher than Fair,” we have a one-sided test here.
Hi @Deepti_Prasad,
Great explanation — you’ve clearly laid out the steps for the Student’s t-test with equal variances, and your reasoning about how to check the p-value against α = 0.05 is absolutely correct. ![]()
One small note: in this lab, the instructions specifically ask us to use type=3 in Excel’s T.TEST function. That’s Welch’s t-test, which does not assume equal variances between the groups. In practice, this is a safer choice, since the spread (variance) of diamond prices for Premium and Fair cuts may be quite different.
So your logic holds perfectly, but instead of pooling the variances, here we rely on Welch’s formula, which adjusts the denominator and degrees of freedom accordingly.
Overall, great job on the reasoning!
Thank you very much for this reply. One thing I want to ask is how to insert the mu symbol in the spreadsheets.
Thank you very much .
O shoot, how could I miss the type mention thanks for pointing out, yes I have come across this diamond cut question, it is one of famous statistical testing question, glad these questions are included.
I haven’t checked the course but usually some of data analytics comes with statistics calculators, so just wanted to know does this course uses or one needs to calculate practically? Although I prefer learning without calculator is good choice at understanding these concepts. O
In these labs we are using Execel, but later on we work with Python (and the stats library).
I don’t remember the exact content of all the labs, but I am almost certain that in some of them we wrote code instead of using the library (so you would need to apply the formulas directly). It’s very important indeed that you understand what the formulas are doing, especially when you’re learning. It also helps to do exactly what you have done here, Deepti: Looking at the questions from other students and reasoning how to answer them; which formula to use, etc.
When you’re working with real projects, it’s common that you need to come back and check a formula or some of your old notes, but as long as your basics are strong, you will be doing great work in the future ![]()
I already do statistical analysis but use more of R and SAS
Cool! Then implementing in Python would be a no-brainer for you ![]()
