I think I may be overthinking this but could someone please explain how I can plot the Iteration vs. Cost graph for the Test Data? I have successfully added my own cost = and cost.append(running_loss) code in my training script to reproduce the graph Andrew displayed in the week 2 “other regularization methods” lecture; however, I’m a little unclear how to plot this for the Dev/Cross Validation Set.
I really like this graph to visually compare CV/Dev to Train but I’m just not sure how to recreate it.
Thank you!!
It should be pretty easy to add that to your code. You just need to pass in either or both of the validation and test data as well as the training data. You’ll need both the input values and the labels, of course. Then when you hit one of the points where you want to compute and compare the accuracy values, you do the same thing with the validation and/or test data that you do with the training data:
Use the current version of the model in “predict” or “inference” mode to calculate the predictions on (say) the test data. Then you run the same logic to compare the predictions to the labels and compute the accuracy.
Thank you @paulinpaloalto! I think I might have a more basic question. If I don’t want to train my model on the CV/Test set but I still want to compute the loss by passing the CV/Test data set through the model, How should I prevent the gradient from recalculating weights? Sorry, I realize this is a newbie question.
I understand how the Predict Code in the opt utils works (screenshot below) but I’m a bit unclear on how to write the code if I want to pass X_test through the model but NOT update the model gradients (since I’m not training). Does that make sense?
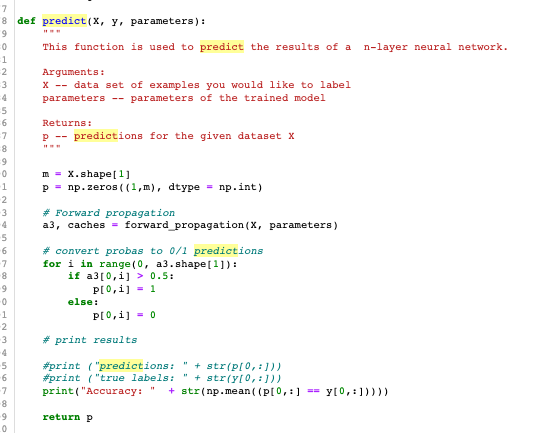
You just call the predict function with the test data as X and y. The code you are showing there is straight python and not TensorFlow, so there is no automatic computation of gradients going on. Of course that version of predict doesn’t save the accuracy. If you want to plot the curves, you’ll need either to modify that code to return the accuracy or do that in the higher level logic that calls predict.
If you’re doing TF, then all this works differently and the training happens during a “fit()” call. If you want data from intermediate stages of the training, you have to supply your own “callbacks” and then you’ll have to understand how to invoke the model in “inference” mode in TF. That’s a whole more complicated topic, but there is a well understood way to do that. Before we go down that rabbit hole, please respond and let me know if that’s what you are really asking about.
This is the provided code from Week 1 - Initialization. It generates the Cost vs. Epochs graph for the Training Data. I was trying to figure out if there is a way to “disable gradient updates” so that I could run the Test/CV data through the same script (or something similar) in order to recreate this graph for the Test Data without modifying the model parameters.
But the whole point is that you can’t “disable gradient updates” even in the case where you want the test information as well. The point is you want to see how things evolve as the training proceeds and that requires that you apply the model as it exists at each point in the training where you are doing the “sampling” of cost and accuracy.
So the only approach is to pass in the test data as well at the top level and then add all the evaluation logic in that “if” statement. Note that you can just call forward_propagation, compute_cost and predict on the test data and it won’t affect the training. That’s because we’re writing everything in python directly here and not using TF. If it were TF, then a similar idea would apply, but we’d have to do a bit more work to tell it how to predict without the gradients.

