I am using LSTM for time series data (personal project) to predict the production of oil, gas, and water (BORE_OIL_VOL, BORE_GAS_VOL, and BORE_WAT_VOL) on real field dataset. My input is all the features (including oil, gas, and water) of the previous time step and output is the oil, gas, and water for the current time step. I used MinMaxScaler of sklearn to scale the data, as shown below but later reversed it for plotting:
To improve the prediction on water as well, I tried:
Adding one or more LSTM layers but poor fit for all
Adding one or more dense layers but poor fit for all
Adding a single Conv1D make the result worst
Different patience of EarlyStopping, 200 gives the best result (but not for water)
Different window size, 5 gives the best result (but not for water)
Different learning rate, increasing from 0.0001 to 0.001 make the result worse while further decreasing from 0.0001 do not affect the results but slow down the process)
Adam with Huber but result is not better than above result
RMSprop with mse and Huber, result is poor
SGD with mse and Huber, result is poor
GRU gives the same results as LSTM, given that the rest of the hyperparameters are the same
So, do you have any suggestions on how to improve the model prediction on water as well? Actually, I am doing this work for my article titled “LSTM for Production”, so I must include lstm layers. And, this one is for multivariate, so, I cannot train three different models for three output, though doing this gives good results.
Moreover, I am using np.random.seed(42) and tf.random.set_seed(42) in the very first cell but it do not reproduce the results on different days. ChatGPT and Bard said it does not produce the same results on different days. However, we are producing the same results on all of our course assignments for many months, right. How to do that?
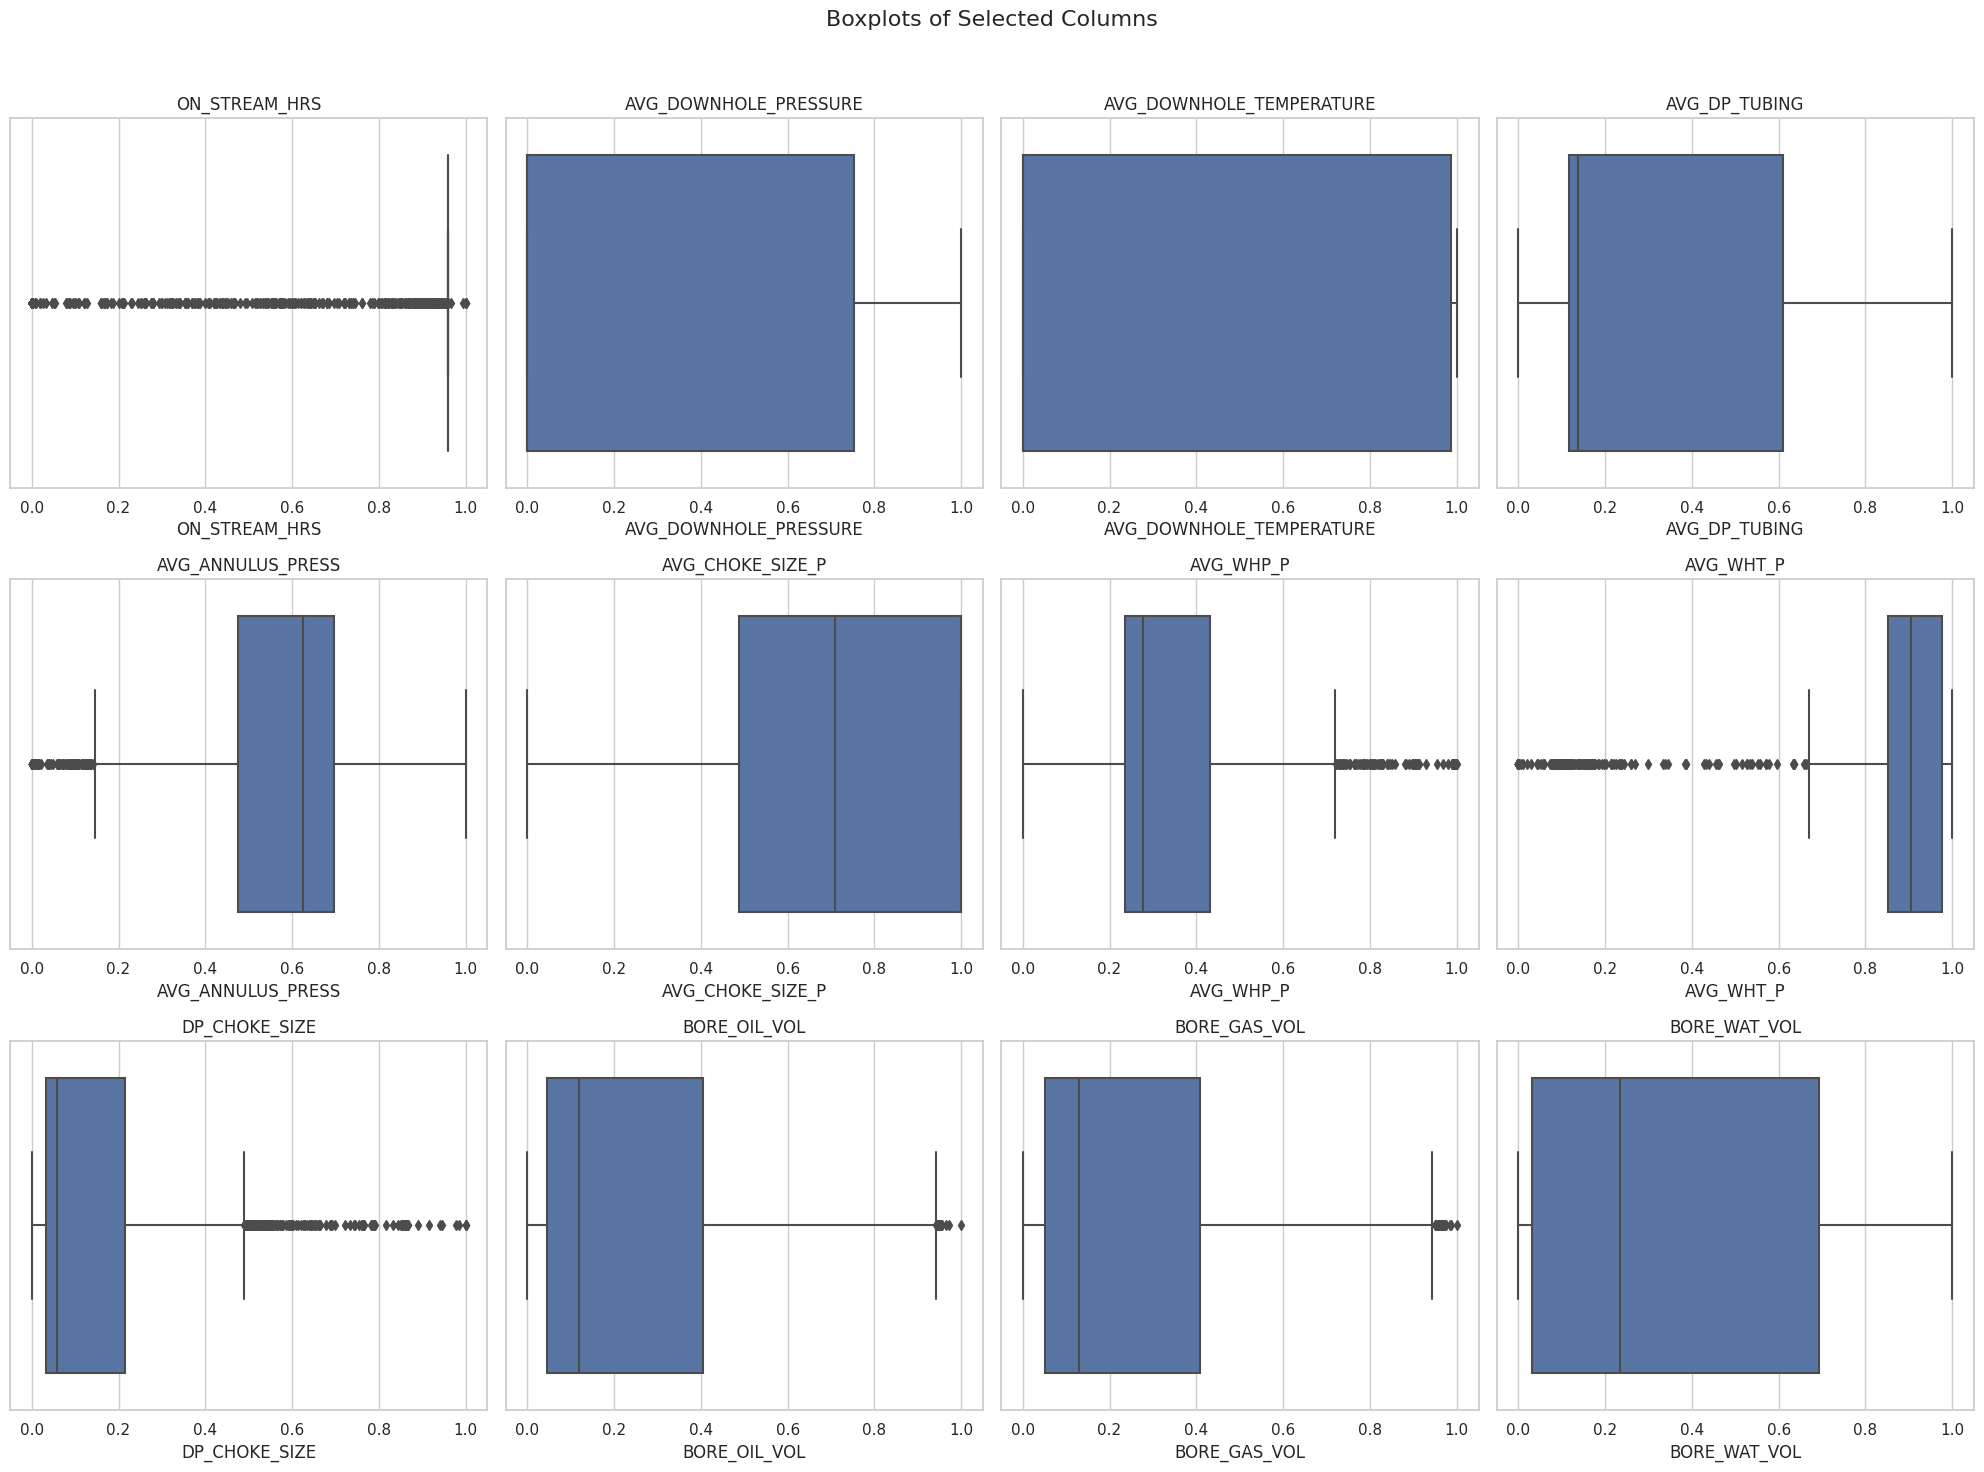
I forgot to mention that I have used Batch Normalization and L2 regularizer, separately, but they worsened the result. And, below is the data distribution, if you want to see it.
Btw, if you add a constant to your water prediction to lift the curve up, then it does not seem to be looking bad. Maybe this is a good direction for investigation?
Is there any physical relationship between the productions of water, gas, and oil?
I somehow feel applying minmax scaler sklearn to this data is not enough as the correlation between then is not a hierarchy relation.
as you know deposits of natural gas are found above the deposits of oil since gas is lighter than oil. Similarly, deposits of oil are found above the deposits of water because oil is lighter than water. If a tunnel is drilled into the Earth, then the deposits will be obtained in the order-gas, oil and water respectively.
If you notice your mean for bore_water vol differs from oil and gas, have you tried applying sklearn.neural network logistic regression analysis for this data?
I agree Raymond stating to move this topic to AI Projects, but probably you chose general discussion to get insight from wider audience?? But do it at your own risk
Try this MANOVA (Multivariate Analysis of Variance) according to your data description, as it has more statistical significance when there are multiple dependent variable
Use multivariate ANOVA(MANOVA) when your dependent variables are correlated.
When the dependent variables are correlated, MANOVA can identify effects that are smaller than those that regular ANOVA can find.
Assess patterns between multiple dependent variables. Factors in the model can affect the relationship between dependent variables instead of influencing a single dependent variable.
When you perform a series of ANOVA tests because you have multiple dependent variables, the joint probability of rejecting a true null hypothesis increases with each additional test. Instead, if you perform one MANOVA test, the error rate equals the [significance level]
This is what I could find in relation sci-kit learn(sklearn) multivariate regression analysis, it might help you
I am not sure it is a common practice (to add a constant to match the curve). We do add biase term but here, we are adding biase again (-1500). What should be my explanation for this, while writing the article?
The order of deposit is right but the order of production varies. We usually do perforation (making holes at the side of a well) in the oil zone. So, gas will try to come to the perforated zone, hence pushing the oil. By doing this, we try to use the force of gas to produce oil and do not need artificial methods (installing motors, etc.) to produce oil. We also utilize the force of water to push the oil. This method is called natural drive mechanism and finding the optimal place for perforation is very important.
Usually, at the start, we have low water production but then it increases. We do some work over to minimize it if it makes oil or gas production non-profitable. Also, there are many more factors contribute to this.
There is no universal relationship between the production of oil, gas, and water. Their production depends on multiple factors, for example, reservoir pressure is the main factor but the size of the water aquifer is also a dominant factor. Also, production facilities like choke size, tubing size (pipe size), and many others.
If you see the figure of data distribution I shared, you will notice that we have the same pattern for oil and gas (we want to produce these) but there is no clear pattern for water (we avoid water production). At the start of production, we had low to zero water production for two years but then it increased while the other two decreased. Then in 2015, it seems like the industry did some workover to produce oil and gas while decreasing the water.
That explains how gas-oil and then water is present in the earth core.
If apply the MANOVA, you would know if the three have any relation, but more than having relation between, I feel it is more about their presence in the earth which correlates with its productivity, the factors affecting could be temperature, soil, water and other atmosphere factors for their productivity.
I tried this, using tf.keras.utils.set_random_seed(42) in a first cell but it didn’t work. Then I revisit some of DLS C5 assignments and notice that we have to use this in every cell where we are generating random numbers.
It won’t work if you repeat running one code cell that uses random numbers without any seed-setting, but I expect you do not, and it should work as long as you run all of the code cells once and in order.
What I said is this can be a good direction for investigation - find out why your predictions are offset by a constant. Without knowing the cause, it is too early to discuss about the practice.
Would this be a problem in your data scaling?
Would your data be the source of this phenomenon - how’re the water levels like within and among your training/validation/test sets, are they fluctuating a lot from time series to time series? did you see the same fluctuation in oil and gas? what exactly have you done to carefully inspect them? Are there any other funny things that only show up in water level data, but not in oil nor gas?
Though fine-tuning may make it better for all three, my objective is to train a model on full set of data.
I tried bi-directional LSTM, Attention, and custom loss (to weight water loss 2.2 and the rest 1.75) but still not good fit for water. The below is the best I got:
However, training three separate models for three output gives good prediction, like the below one for water. But the main point is to have one model for whole field.
There are two reasons comes to my mind why not have a good fit for water.
Water pattern is totally different than the others, so, model have difficulty learning multiple patters.
I am not using the full data that represent the whole field.
Vovle dataset has around 40,000 files, including:
Geophysical data, including interpretations
Geo-Science Archive
Production data
Report
Static models and dynamic simulations
Seismic data
Well logs
Well Technical Data
Realtime drilling data
I am using only production data (dynamic data) data covers only temporal aspects. I must have to use all the availabe data and extract the spatial features of the reservoir to have one excellent model for full field. Like the one published by my professional friend, Amir Ansari:
Can you elaborate what kind of data these two have, also if you can briefly explain other data such as report, static models and dynamic simulations, seismic, well logs, well technical data, realtime drilling data.
The reason I am asking you to have a better understanding towards your model approach.
As you mentioned your friend used the whole data is actually really good. But we can also approach the model by selective data approach to avoid training time and cost efficacy.
Another question I wanted to ask why did you also only choose production data for your mode, what was the brain/thought behind that approach(again asking only to understand you choice)
Seeing whole dataset I can tell why you model was more inclined towards oil and gas as you chose only production data which would surely be reciprocal to what product is more found in the region of interest. So to have more accurate approach so your model is able to get the productivity of all 3 reservoir would be selective data filter from the whole dataset but having an understanding to make sure one can have as reduced training time as well as cost.
Please reply for the question I asked, so further it can be discussed.
Spatial data: Changes with different locations in space.
Temporal data: Changes with different points in time.
Spatiotemporal data: Changes with both different locations in space and different points in time.
In our oil industry, production data is the temporal data (dynamic data) and that is very easy to get it. This data mostly depends on our choices: well and surface settings we choose. However, the spatial data is the reservoir data (porosity, permeability, etc.) and we cannot calculate it directly, as the reservoir is thousands of feet beneath the earth and we cannot touch it, or see it. To get the approximate spatial data, we do numerical simulations using different software called Simulators.
The other data you asked about is the simulator’s data in which we are trying to get an accurate approximation of the spatial data. Dr. Amir Ansari, I mentioned earlier, didn’t use all the available data. He did extensive features extraction from all the available data for his Ph.D. dissertation and for commercial purposes (for industry).
What I wanted to know in the data you mentioned other than production data, What are the other columns (to have understandings what could be used for model prediction for oil, gas and water production)
I understood your point of view of choosing temporal data.
This is the reason I am asking details about your data.
I suspect that this problem is related to the data itself and not the LSTM model that you are building. Looking at the statistics you provided in the beginning, I think you should go back and plot the distribution of each column. Check for heavily skewed distributions and outliers and you might find your problem.