Measuring purity vid

  1. My first question is regarding to how impurity is measured. If you look at the image below, I know that there is 5/6 examples that are classified as cats. 5/6 = .83; which is why he has the dotted line going to the line then going across to the left of the graph which will eventually give him .65. I thought having 5 out of 6 correctly labeled examples would be good but it is only has an impurity of .65. Given this example, I guess you could say I think I am confused with what this entropy is trying to tell us.

image

  1. my second question is regarding the image below. I do not understand what this equation is doing at all. I am trying to wrap my head around but it just does not make any sense.
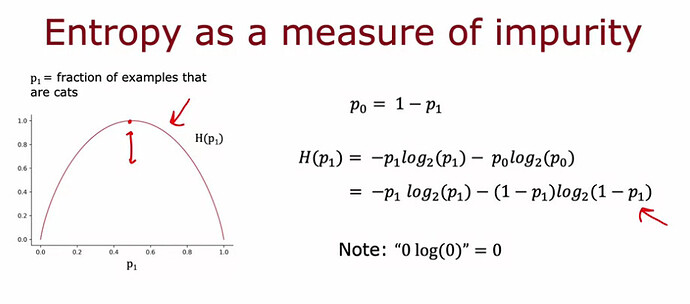
regarding to the first question the impurity calculated using this equation
image

if the classified as cats. 5/6 = .83 = p1 , you would calculate the p0=1-p1=1-0.83=0.17 after that substitute in the equation you would get .65 which represent the impurity(entropy),
regarding to the second question the equation measure the pure of data we have or examples we have if the data if all cats or dogs only the pure is 1 if not the pure will decrease and the opposite is true with impurity

  1. I just want to make sure of something. So purity is all about trying to correctly identify the right values within categorical variables and opposite is impurity, basically to correctly identity the wrong values?

  2. if you look at the image below, the reason why you get this type of curve is because if you look at our raw dataset; you notice that there are 5 cats and 5 dogs, 50% for each data point. that is why if p1, aka if you divide by 5/10, we would correctly identify 5 cats. there are only 5 cats within the dataset; so we identified all cats correctly which is why our entropy would be 1. Is this statement right?