Hello, Regarding Week #1 Topic: Unsupervised Learning: Clustering: Choosing the value of K: For each point from i = 1 to m clusters = 1 to K, we can define the cost function J(c1, c2, …, cm, mu1, mu2, …, muK) as the sum of squared differences: J = (1/m)*sum(||[X(i) - mu(i)]||^2). This results in an array of costs. Is it ok to store the lowest_costs_per_K = {}, Consider the lowest cost Jmin(c, mu) as the cost for a specific K when evaluating and plotting the k-means using the Elbow method (Cost Function(J)/K(Number of clusters)
In the definition of “run_kMeans(X, initial_centroids, max_iters=10, plot_progress=False)”, I have included additional steps such as:
“”“python script
costs =
Run K-Means
…
for i in range(max_iters):
idx = find_closest_centroids(X, centroids)
cost = 1/m*(np.sum(np.linalg.norm(X - centroids[idx.astype(int)], axis=1) ** 2))
costs.append(cost)
…
return centroids, idx, costs
“””
Next i want to create a python dictionary for the lowest costs per ( K ) as follows:
“”“python script
lowest_costs_per_K = {}
for K in range(1, 10):
initial_centroids_for_K = k
Means_init_centroids(X, K) centroids, idx, costs = run_kMeans(X, initial_centroids_for_K, max_iters=10)
lowest_costs_per_K[K] = min(costs)
“””
When I plotted the Elbow method (to determine the value of K) with a sample dataset, it appeared as below. My main question is whether we can interpret this as a cost function (J) that represents the minimum of J(c, mu) for K values of 1,2,3,4,5,6 and so on.
You’re not really computing the “cost” for clustering, because cost requires that you have labeled data. So you’re really just computing a similarity score for the members of a cluster.
This is sort of a losing proposition, because as K gets close to the number of examples, the “cost” computed in this way will approach zero - because ultimately each cluster will have only one member - itself.
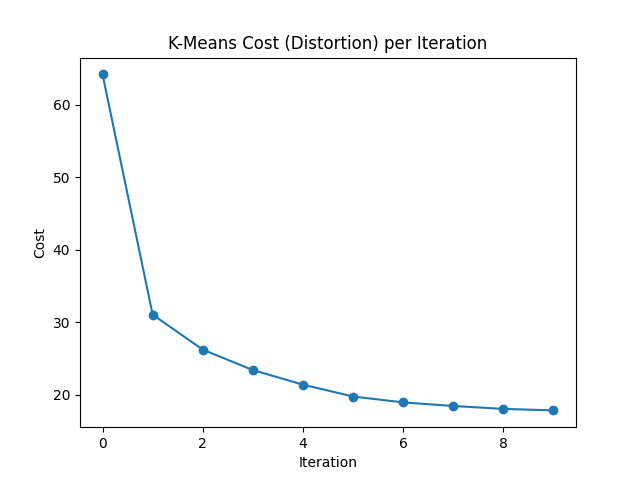
Hello, Thanks for your reply. Let me explain what I was trying to accomplish. I was evaluating the cost distortion function for each iteration and visualising it as a graph of Cost vs iteration. My objective is to determine whether the distortion decreases with each iteration. to accomplish this, I used the following practice code in the Lab, including the following cost function as follows: cost = 1/m*(np.sum(np.linalg.norm(X - centroids[idx.astype(int)], axis=1) ** 2)). I assumed that I already have the cluster assignment variables (C^(i)) and cluster centroids, but I understand that they are not finalised yet. I want to thoroughly monitor the distortion during K-Means iteration process. After running the following code, I created the and observed the following results.
Finally, I collected all the finalised centroids, cluster assignment variables (C^(i)) or indexes (idx) and costs and executed the code below to plot the Elbow Method: Cost Function (J) vs. K Please correct me if my understanding of evaluating and plotting the Elbow Method: Cost Function (J) vs. K is inaccurate.
Note that Andrew has mentioned that the “elbow method” really doesn’t work very well (if he didn’t say that in this course, then it was in the previous iteration).
Thank You! During the “Choosing the number of Clusters” session, Prof. Andrew Ng also highlighted that selecting right number of clusters can be truly fuzzy and why. Also, he stated that selecting K in order to minimise cost function (J) is not a best practice. Therefore it’s essential to find a trade-off between cost function (J) and cluster size (K) based on unique qualities of specific domain data, and additionally, there is also a lab exercise under 4-5 - Image Compression with K-means that is relevant to this topic.