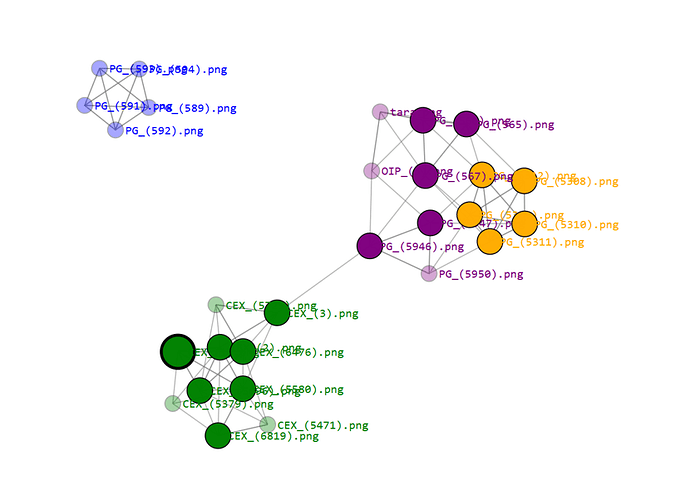
I love PCA for visualizing vectors, but I really like the same data shown in a force-directed graph. I found the D3blocks library, which allows you to have animated FDG plotting, but you can code in Python.
For more on D3blocks, visit…
For more on my code, visit the Georgia Project, GitHub - KatherineMossDeveloper/The-Georgia-Project: Study of the cropped images in the OpenCrystalData dataset on Kaggle.
For more on the data, visit the OpenCrystalData dataset…
Crystallization impurity detection | Kaggle.
