I am running the notebook on local machine (Mac). Plotting the graphs is working fine but they are not interactive. Details below:
- plt_intuition(x_train, y_train) is plotting the graphs fine but the sliders are not drawn to play with the w value! I see the following error message below the graphs.
interactive(children=(IntSlider(value=150, description=‘w’, max=400, step=10), Output()), _dom_classes=('widge…

- plt_stationary(x_train, y_train) and plt_update_onclick(fig, ax, x_train, y_train, dyn_items) are plotting fine but not interactive.

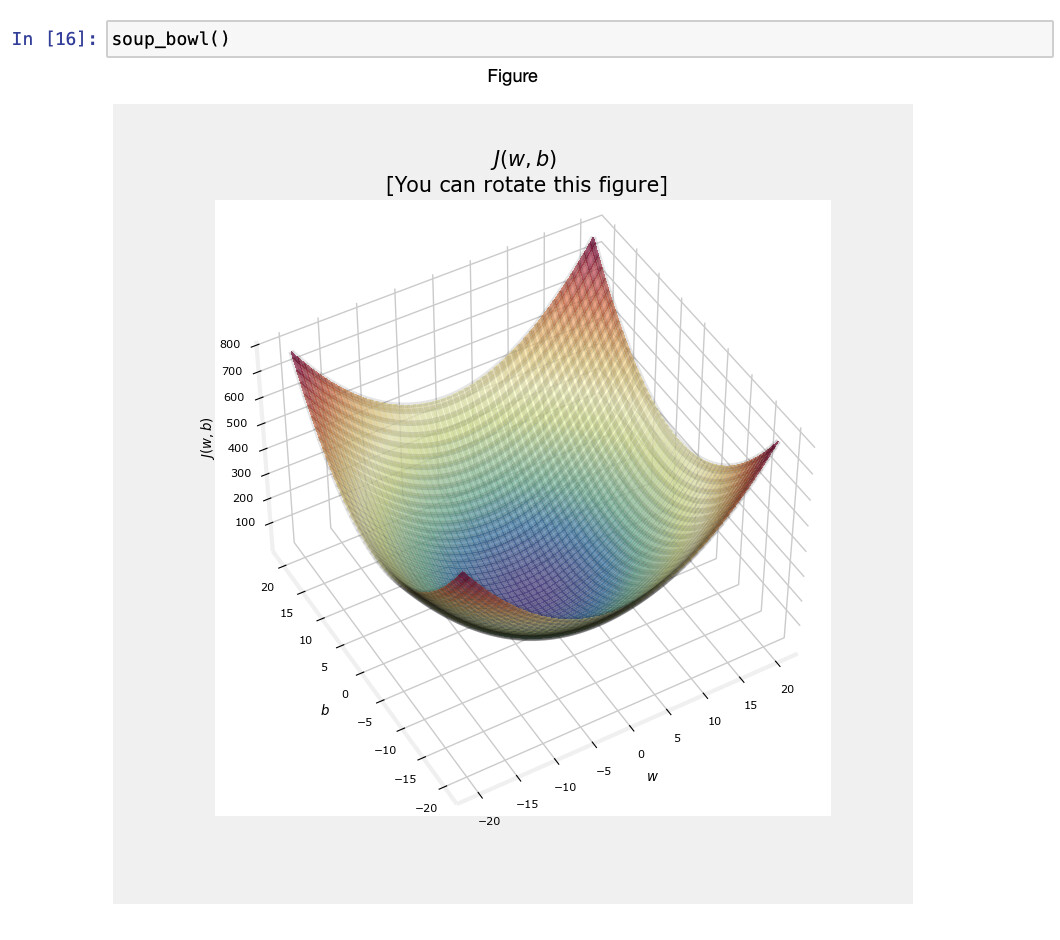
- soupbowl() is not interactive.
I am assuming that I will run into similar issues in future labs and would greatly appreciate if anyone can point me in the direction of fixing this in local env.
Thanks