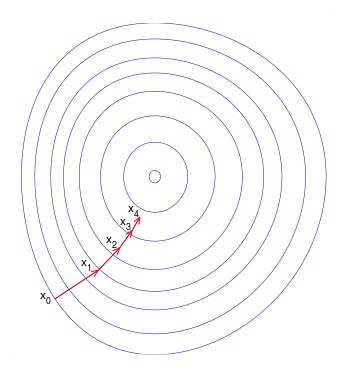
In the “Plotting” section, the contour plot has the “path of gradient descent” overlaid with red arrows. I would expect the red arrows to be perpendicular (normal) to the contour lines. Can anybody explain to me why this isn’t the case?

2 Likes
this is cut of 3 dimensional (or even more dimensional) spatial behaviour. Path even might not be as direct as shown here! Why should the arrows be perpendicular to the contours?
1 Like
Lab 4 is focused on the behavior of the batch gradient descent algorithm in a univariate linear regression. Univariate linear regression means the cost function is a function of w and b. So I’m not sure why you write “or even more dimensional spatial behavior”. It’s 3 dimensions.
Gradients are perpendicular to the contours. So I would expect the path vectors to be perpendicular to the contour lines. Since the lab is using batch gradient descent, the calculated gradient is exact; it’s not an estimate or approximation.
This is what I would expect to see:
2 Likes
Hello @eric11235 Eric,
I believe that is because our impression of the “right angle” is always based on that we have an 1:1 image aspect ratio.
Check this out:
(Below is a GIF animation)

(Below is an image)
The GIF shows how changing the aspect ratio “correct” our “right angle”. The code controlled the aspect ratio with the figure size and the ranges of w and b, so you may change those settings to make it 1:1 like what I have done below:
(Below is an image)

As you can see, (1) same range for both w and b, and (2) a square image.
Cheers,
Raymond
6 Likes
Excellent point, I did not notice that the graph axes were skewed.
2 Likes
Son of a gun. Thanks for taking the time to make the animation!
2 Likes
Our hero @rmwkwok has solved the mystery, but I wanted to speak to something you wrote: "dj_dw and dj_db are not shown in that plot, as it would require a 3D rendering. I don’t think that’s true. (dj_dw, dj_db) is a vector in 2 space. The contour plot has w and b axes, and that vector can be plotted in that plane. The value of j is not important, but the resulting j after the values of w and b are altered is visualized with the contour lines.
2 Likes
I realize that better now, and I’ve deleted my post.
1 Like
Yup, @eric11235, if you like some maths, you can think about this like the below too:

Cheers,
Raymond
2 Likes
Exactly! Thanks.
2 Likes
These are drawings anyways to give you an idea of what it supposed to happen they are not architectural designs!
1 Like
Gradients are perpendicular to the contour lines. I think it is important to understand this when one is learning about the behavior of the batch gradient descent algorithm and how it seeks a local minimum. From a pedagogical standpoint, the plots, in my opinion, should highlight this fact, not obscure it. It appears that you have a different opinion.
3 Likes
There has a been a ticket submitted to address this issue.
I think it’s been covered adequately.
Closing the thread.
3 Likes