A similar question was asked here about a year ago.
In the gradient descent lab, the path shown doesn’t seem perpendicular to the contour lines, which contradicts the expectations of the poster and commenters. Here is a screenshot from my lab.
However, when you use the “zoomed-in” version (I changed some of the parameters from the default values), you can see that the path is perpendicular to the contour lines.
Also, it’s interesting (at least to me, a new learner on week 1) to see that the shortest path (following the steepest downward slope) is not a straight line in the contour plot from the starting point to the minimum. In this case, the path goes up and to the right and then down and to the right, always staying perpendicular to the contour lines.
Questions
Could there be a bug in the gradient plot function plt_contour_wgrad() and that’s the reason the path is not perpendicular in the first screenshot? But when you zoom in and pass different parameters to the same function it goes through a different code path and the plot is correct?
I’m new to Python so I thought of asking here before debugging it.
For the 2-parameter case we are learning here, in which J(w,b) is an elliptic paraboloid, is the gradient descent path (which is the shortest path), all on the same plane?
If yes, this is similar to how a great circle is the shortest path between 2 points of a sphere, and all the points in the path lie on the same plane (i.e. if you look at the path from a certain perspective, it looks like a straight line on a 2D plane).
This is more out of curiosity. Not sure if it has a lot of significance to the course or machine learning in general.
For your first question, I encourage you to try and see what is causing what you see. (Edit: I have added a GIF here to show what’s causing it) After you are sure that the function is giving the correct gradient path, then you can test if the path is always on the same plane for your second question
It has been some time, but in case it helps, you may check this post out for a GIF that shows the magic. So, for your first question, I think it is not a bug.
Btw, what do you think now about the second question? I guess the first thing would be: how do you define a plane, for example, in our 2-parameter example?
There is not bug. What you observe is the simple degeneration for trying to plot a 3D curve into a 2D plane. What you see is a projection of the 3D surface into the 2D plane, and it will depends on your point of view. So, if the observer is aligned with the origin in x, y, and the “center” of the ellipsoid in in (0,0,0), you will see that all the gradient lines are straight lines going from any point in the border to the center, but only 4 will look perpendicular to the contour lines, while the others won’t. In this examples, only the gradients parallel to the axis look perpendicular. The other in red looks like not parallel. Changing the ratio could help to make the red line artificially look perpendicular, but it will just fix the problem for ellipsoids. In more complex topologies it won’t.
I don’t think what you mentioned is technically correct. I may be wrong, so I wanted to share my thoughts to discuss it further and for future reference (for myself and others).
I agree that the problem is a degeneration of the plot, but the issue seems to be that the 2D plot didn’t have a 1:1 aspect ratio, thus making the 90-degree angles look acute or obtuse. @rmwkwok pointed this out and linked it to a comment showing clear evidence of the issue. It’s not a bug in the code, but it is a bug in the visualization. As someone commented in that post, the steepest slope is always perpendicular to contour lines and this course should make that clear rather than obfuscate it.
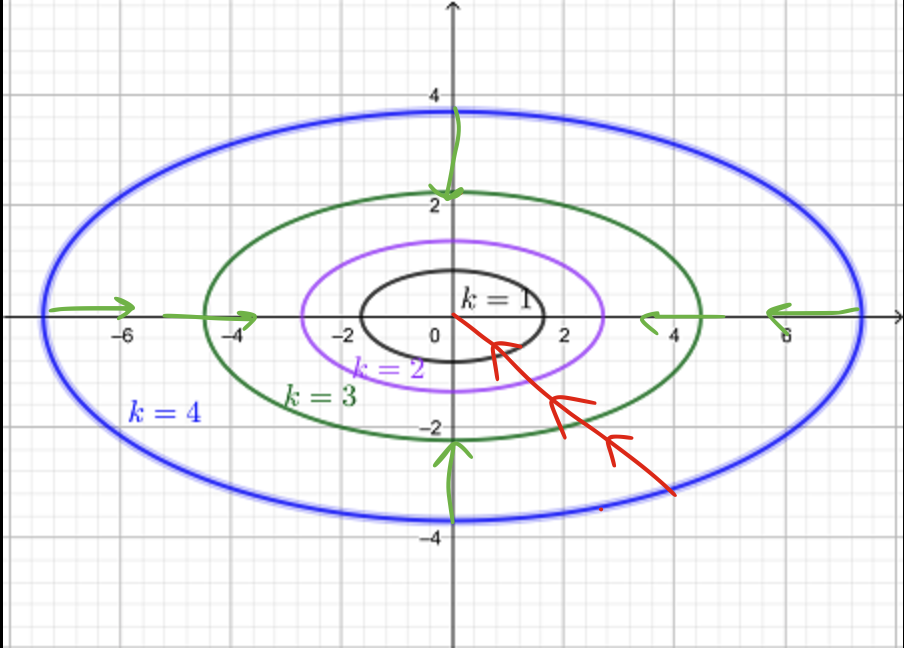
In your visualization, the green arrows show the steepest slope, but the red arrows are not the steepest slope. The shortest past from the blue contour line (k=4) to the green one (k=3) is not along the red arrows. I try to show this by using a circle centred around where the first (bottommost) red arrow meets the blue (k=4) contour line. You can see that the circle touches the green (k=3) contour line at a different point.
Although this visualization is a projection of a 3D surface onto the 2D plane, because the surface is smooth and monotonous, I think we can safely say that the shortest path on the surface between the blue contour and the green contour is also the shortest path on this 2D projection (i.e. the radius of the circle, shown in black).
Another way to think about it is this.
this is an elliptic paraboloid (it has elliptic cross-sections)
it has the minimum at the origin
the steepest slope at point (0, -4), where the y-axis meets the blue contour at the bottom, only has a y-component and it has some value A.
the steepest slope at point (7, 0), where the x-axis meets the blue contour on the right, only has an x-component and it has some value B.
|A| > |B|
Therefore, when you are at the middle point between (0,-4) and (7, 0) along the same contour level (the center of the circle), the steepest slope will have a larger y-component than an x-component (shown by the black radius line).
The steepest slope is not a 45-degree line (like the red arrows) because the x and y components of the slope are not symmetric, just like an ellipse doesn’t have an equal radius all around.
If we make the paraboloid have a circular cross-section, then the steepest slope would be along the red arrows. The radius of the black circle (which matches the red arrows) is the shortest path between the blue and green contours, starting from the center of the circle.
Yes. That is completely correct. I was assuming that the gradient descent was taking the shortest path, which is the red line, but it actually takes path with the “less energy” between the points.