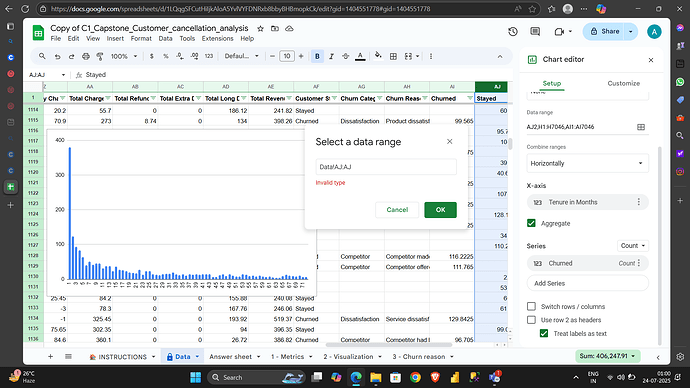
I keep on trying the 4th question, when I plot the chart, I am getting wrong values. For instance, the tenure aggregates for stayed category corresponding to 1 should be zero. But I am getting some different value. Can somebody help where i am doing wrong. Thank you.
Hi Anish_Das123,
This likely means that there is an issue with your formula for calculating the Stayed column (and possibly also for the Churned column). I would suggest reading steps 1 and 2 carefully and see if you can adjust your formula. Make sure to retain the correct formula after sorting the table from low to high (use relative references rather than absolute ones). I hope this helps.
Can you explain why I am still getting error adding stayed column it still shows invalid type even it is numerical value.
It could be because you are including cells that are not numerical. I seem to recall there are two cells at the very end of the column that fall outside of the rows of the data that may get included when you use keyboard shortcuts. You can exclude these by either deleting those two cells or by selecting without using keyboard shortcuts. If that does not solve your problem there may be an issue with the formula you are using.
I tried this one too. that’s means i have error in formula but i used the same formula for churned column it shows numerical type but in stayed column it becomes text.
the formula in churned column is [formula removed by mentor] and for stayed column is [formula removed by mentor]. Can you say why this happening.
It looks like you are entering a space as a string (" “) in case the criterion is not met. You could try using a null string (”"), and see if that makes it work.
Finally, it worked thank you very much for the help and it also solved the churned reason part of the question too.
You’re welcome, Anish_Das123. Happy learning!

