Hi, I would like to ask
- why the w0 and b values for the second dataset in Gradient Descent For Logistic Regression lab are such that the sigmoid function isn’t steep enough to pass through all data points:

What I mean is that I would have supposed if the blue line sigmoid(z) passed through 3rd and 4th point here (and was therefore much more steep), the probability would’ve been more precise.
Something like this:

(sorry for a hand drawing in purple)
The contour plot doesn’t let me click in the center of the smallest circle, but is my guess correct that here the cost would be nearly 0 and the sigmoid would be as the purple line on the graph above?
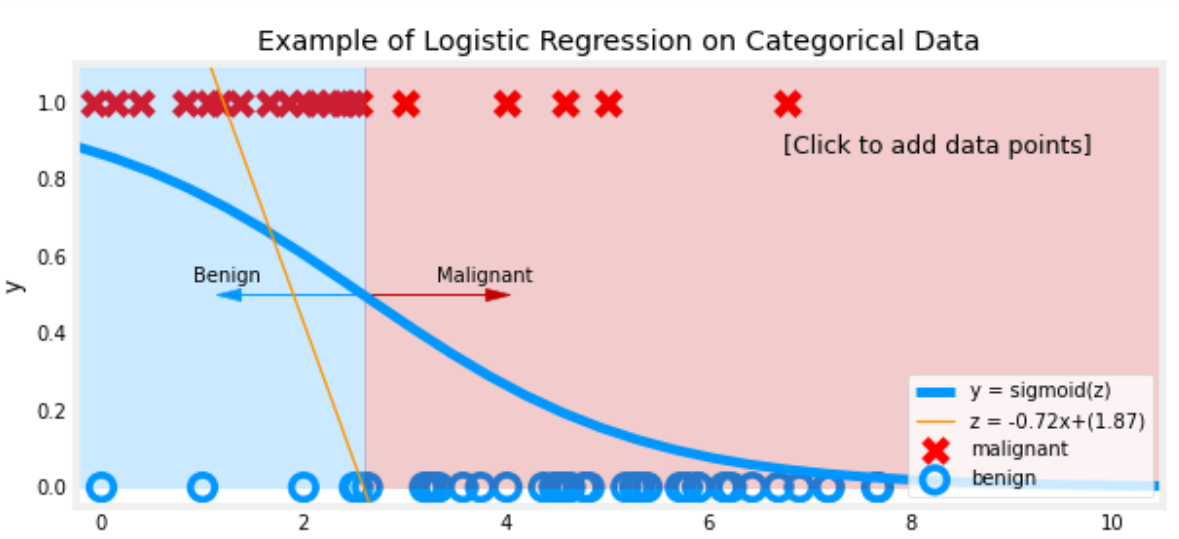
- I am trying to understand what is the meaning of the cost for point that the sigmoid doesn’t pass through, for instance if the data points were as such:
(I managed to “reverse” the prediction!)
Do I understand it correctly that
- the cost for a point (error) on below graph would be as I marked with purple, for the reason that for such Sigmoid blue line, the total loss is minimal, even tho still big?
- and that for below data, it is impossible for the model to have a zero loss?

Full plot for reference:

- And lastly, do I understand it correctly that the orange line z is the decision boundary but plotted on sigmoid graph?
I think understanding it well would help me to understand the interpretation of the math in the area where it is unclear whether a tumor is malignant or bening, even for a professional doctor. I’d greatly appreciate help here.