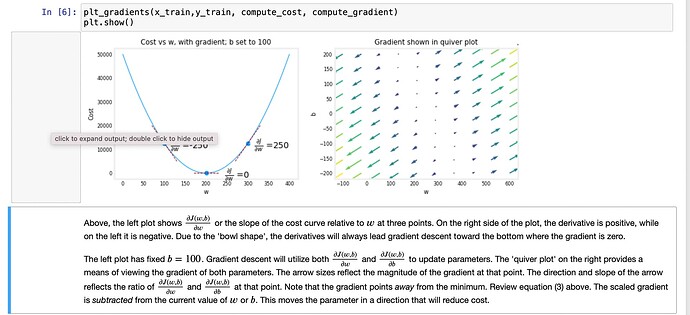
Can someone please explain what the quiver plot represents. I am confused after reading the lines " the arrow size represents magnitude of gradient" and The direction and slope of the arrow reflects the ratio of ∂J(w,b)∂w and ∂𝐽(𝑤,𝑏)∂𝑏 at that point.
This is in reference to Course 1, Week 1, Lab 4 Gradient Descent Solution
That’s a confusing method of showing the gradients as vectors within a 2D plot.
